
Data and dashboards
One view of your business. Numbers everyone agrees on.
Your accounting, sales, billing and warehouse systems each tell a different story. We connect them, agree what each number means, and build one dashboard your whole team trusts. You own all of it.
For growing companies whose numbers live in several systems. Starts with a two-week, $5,000 Sprint; your first live dashboard comes in week two.
- Accounting$1,437,600the ledger: this one is right
- CRM$1,457,100counts deals that ship in October
- Billing$1,465,900adds freight, misses late credits
$1,437,600, agreed
Invoiced, net of refunds, counted on the day it ships.
What your reports already cost you.
Nobody sends you this bill. You pay it every year anyway.
Change any underlined number to match your company.
Rebuilding reports by hand
reports a month, hours each, people at an hour
$33,120Arguing over whose number is right
hours a month, people in the room at an hour
$27,000Decisions made on late or wrong numbers
Not priced here. Usually the biggest line.
Not priced
Total, every year
$60,120An estimate from your numbers, not a promise.
One customer. Three records. We make it one.
Accounting
Harbor Fasteners
Customer 10442
1180 Wharf Rd, Charleston SC
September $128,410
CRM
Harbor Fasteners Inc
Account HF-0291
1180 Wharf Road, Suite B
September $128,410
Billing
HARBOUR FASTENERS INC.
Cust 7781 + Cust 9034
Two accounts, one renamed
September $96,850 + $31,560
One customer
Harbor Fasteners
Accounting 10442 · CRM HF-0291 · Billing 7781, 9034
$128,410
September revenue, counted once, the same in every report.
Click any number.
A few headline numbers from a made-up company’s dashboard. Click any one to see what it means and where it came from.
Revenue, September · Are we on plan?
$1,437,600
Agreed by finance and sales, 12 August
The CRM and billing each gave a bigger total than accounting for September. Accounting had it right; here’s why the other two were off.
- Accounting$1,437,600Already right
- CRM$1,457,100 (wrong)Counted $61,400 that ships in October, and counted $15,300 of quotes with no order, and missed $36,200 won in August, and missed $21,000 of counter sales
- Billing$1,465,900 (wrong)Counted $18,900 of freight as sales, and missed $9,400 of returns credited in October
Agreed $1,437,600
Show the workingsHide the workings
1 What it means
Invoiced, net of refunds, counted on the day it ships.
- Where it comes from
- Accounting, with ship dates from the warehouse
- Who answers for it
- Controller
- Agreed
- Agreed by finance and sales, 12 August
2 The transactions behind it
Customer Shipped Document From Amount Ostrander Mills Sep 30 INV-49898 Accounting $2,529.28 Beaufort Builders Sep 30 INV-49901 Accounting $1,393.02 Daniel Island Yacht Services Sep 30 INV-49899 Accounting $1,140.14 Santee Roofing Sep 30 INV-49896 Accounting $942.08 Goose Creek Boat Yard Sep 30 INV-49897 Accounting $432.54 Keel & Co. Marine Sep 30 INV-49895 Accounting $406.67 + 1,212 more invoices Total $1,437,600 3 Checks
- Every invoice matched to a shipment
- Refunds netted in the month they’re issued
- Ties to the closed September books
Northgate Supply Co. doesn’t exist, and every figure here is illustrative. Yours will use your systems, your definitions and your rows.
That was a few numbers. Here’s the whole dashboard.
Seven tabs for the owner, the controller, sales and operations. Cash, what’s owed, margin, stock, the month-end close and every system it’s connected to. Click anything; it all opens to the rows.
Open Northgate’s dashboard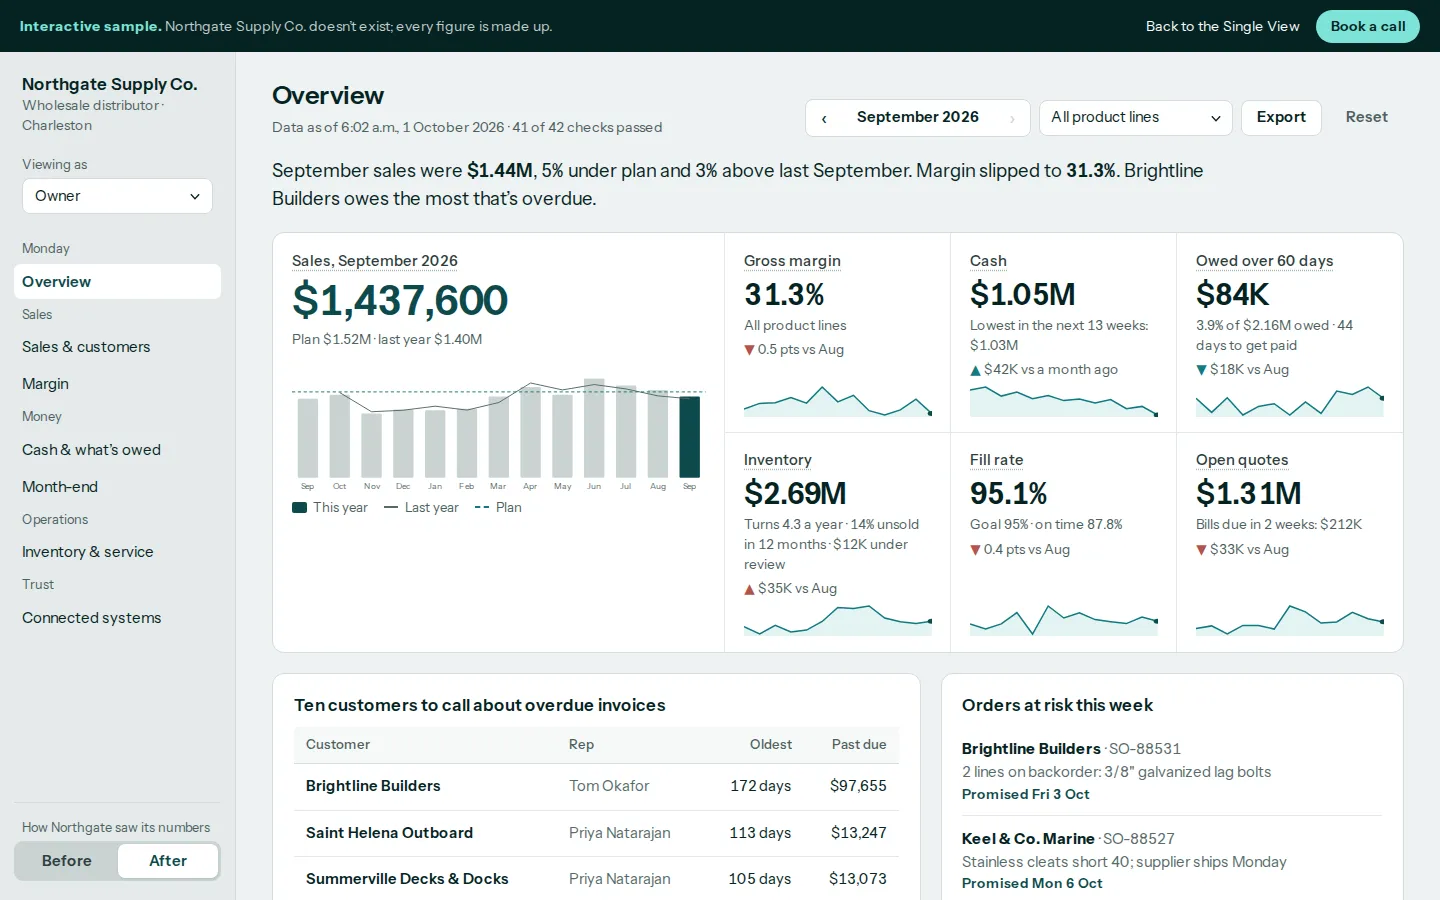
Want AI? Fix the numbers first.
When mid-sized companies explain why their AI projects stalled, most don’t blame the AI. They blame messy data and systems that don’t talk to each other.
So getting your Monday numbers right is most of the groundwork for AI too. You do the work once and get both.
53%
Messy data
47%
Systems that don’t connect
33%
Couldn’t see the payback
What you get. What you own.
Your systems, connected
Accounting, sales, billing and warehouse data in one place, updated automatically, in a cloud account your company owns.
One meaning for every key number
A one-page list your leaders sign off: what each number means, where it comes from and who answers for it.
Customers counted once
The same customer, product or job matched across systems, even when each one spells it differently.
Dashboards your team opens
Usually four to eight, built with the people who use them, in the tool that fits your team. Click any number to see where it came from.
Alerts
A message to the right person when a number moves the wrong way.
Training and a manual
So your team can run it without us. Then 30 days of fixes, included.
- Revenue
- Invoiced, minus refunds, counted on the day it ships.
- Owed over 60 days
- Unpaid invoices more than 60 days past due, after credits.
- Shipped on time
- Orders shipped complete by the date we promised the customer.
…and the rest of the numbers your leaders use, on one page.
Finance
Sales
Operations
Your data and dashboards are yours from day one. The code and documentation are yours on final payment.

Something working at week two. A demo every Friday.
Weeks 1–2
The Sprint
We map your systems, agree the numbers that matter, and connect the first one.
You see: Your first live dashboard, with your own data
Weeks 3–4
Connect and match
We connect the rest and join up customers that appear under different names.
You see: A list of every mismatch we found and how it was settled
Weeks 5–6
Check the numbers
We check our totals against months you’ve already closed, so you know they’re right.
You see: Our numbers side by side with your books
Weeks 6–8
Dashboards and training
We finish the dashboards with the people who’ll use them and train your team. Then 30 days of fixes.
You see: Your team running it
Published prices. Fixed in writing before we start.
Start with a two-week Sprint
$5,000 fixed
We map your systems, agree the numbers your team argues about, build one live dashboard with your own data, and give you a fixed price for the rest.
Credited in full if you go ahead within 45 days. If you don’t, you keep everything it produced.
Connect one system
from $12,000 three to four weeks
One system cleaned up, with the dashboards that answer its questions.
Connect all your systems
from $25,000 six to eight weeks
Three or more systems joined up, customers matched, your agreed list of numbers, four to eight dashboards and alerts.
Ongoing support
from $1,500 a month
We fix anything that breaks, keep up when your systems change, and go through the numbers with you every quarter.
What changes the price: how many systems, how messy the data is, how many companies or locations, and how many dashboards. Software and cloud costs are billed to you directly by the vendors.
A good fit
- Your numbers live in several systems, and someone rebuilds reports by hand
- Your leaders argue about basic numbers
- Someone on your team owns finance or operations
- You want to own what we build
Probably not
- One system already holds everything, and its reports answer your questions
- You already have a data team and a modern data warehouse
- You want a dashboard without fixing the data under it. It would only show the mess.
Fix the data first
If your CRM is full of duplicate customers and empty fields, a dashboard will only show you the mess. The Sprint measures how bad it is. Sometimes the right first step is a clean-up, and we’ll tell you.
Questions
What finance and operations ask first.
Do we have to replace any of our software?
No. We connect what you use now. If one system is the real problem, we’ll tell you in the Sprint.
Where does our data live, and who owns it?
In a cloud account your company controls. Your data and dashboards are yours from day one; the code and documentation are yours on final payment. We only read from your systems wherever they allow it, and our access ends when the project does unless you choose ongoing support.
How much of our team’s time will this take?
About an hour a week from someone in finance or operations, plus one person who can sign off on what each number means.
How soon do we see something?
In the first two weeks: a working dashboard, with your own data, in your own account.
Which dashboard tool do you use?
The one that fits your team: the tool you already pay for, or one we choose together in the Sprint. The numbers underneath are the same either way.
What does it cost to run each month?
That depends on the tools you pick. We estimate it in the Sprint, before you commit to the build, and those bills go straight to you, not through us.
What if our data is a mess?
That’s normal. The Sprint measures how messy it is and prices the clean-up. Sometimes the right first step is a clean-up before any dashboard, and we’ll tell you.
Start here